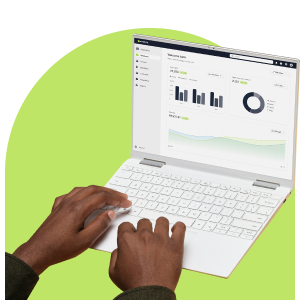
Every two years, we do a deep analysis of the billions of emails we send in South Africa, so we can give you real local data from which to benchmark your own marketing emails. Want a quick look at the results of our 2018 analysis? Here it is:
Our benchmarks have changed the local email-marketing game. May this year’s figures do the same for your email messaging. Get the full report here.


